Date
In preparation for our recent geospatial short course, I spent some time getting up to date on the new features in the leaflet R package. There are so many possibilities between the new add-ons in “base” leaflet, like inset mini maps and measuring tools, and even more functionality being added all the time in leaflet.extras, mapedit, and mapview.
One of the things I really enjoy about leaflet is how you can visualize and explore spatial data relatively quickly. Many public data sets like National Land Cover & National Hydrography from The National Map, and even real time weather and satellite data are available as web mapping services that make it possible to add layers of these data sets with just a few lines of code.
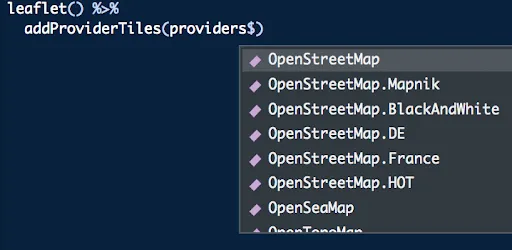
A really nice update to leaflet is that it’s now easier to add different base map layers, since the providers list now ships with the package. Whereas you used to have to quote the exact name of the map layer you wanted to use, tab-completion now makes it possible to just scroll through the list of 110 providers!
Image
There are multiple layers from NASA’s Global Imagery Browse Services, including various MODIS layers. Digging into the options (somewhat browseable in the providers.details list) it turns out that you can specify the date of the retrieval, making it possible to make your own Shiny app to browse through the MODIS archive. How cool!
The key part of this app is the dateInput widget, which appears as a mini calendar in the user interface. The selected date gets stored as an input variable, and is used in the time argument for the provider tile options. Depending on the time of day, today’s imagery might not be available yet, so it might be helpful to set a default value for the date input widget (and max = Sys.Date() since future dates’ imagery won’t be available either!).
library(shiny)
library(leaflet)

ui <- fluidPage(
  dateInput(inputId = "selected_date", label = "Imagery Date"),
  leafletOutput("map")
  )

server <- function(input, output) {

  output$map <- renderLeaflet({
    leaflet() %>%
      setView(lng = -76.505206, lat = 38.9767231, zoom = 5) %>%
      addProviderTiles(providers$NASAGIBS.ModisTerraTrueColorCR,
                       options = providerTileOptions(time = input$selected_date))
  })

}

shinyApp(ui, server)
Get the code for this app on GitHub.
Share
Related Content
Creating Visualizations with DiagrammeR
ggplot Tricks Not to Forget About
The interactive visualization gap in initial exploratory data analysis
Article published in IEEE Transactions on Visualization and Computer Graphics