
Date
Overview
Image
A downloadable version of this lesson is available here:
Document
Complex systems are all around us. Whether we are talking about economic, ecological, or social systems, they all are comprised of multiple components connected by interactions that vary in strength and direction. Viewed this way, network diagrams and the science of network analysis are very useful tools for understanding complex systems and how they function. Will more connections result in a system that is more stable overall, i.e., more likely to recover from some disruption? Will loss of one or more components from the system render it less robust overall, i.e., more likely to completely collapse? These are the types of questions that ecologists and social scientists have long asked about the respective systems they study. More recently, environmental scientists from many domains (ecology, hydrology, physical geographers, etc.) have joined forces with social scientists (sociologists, anthropologists, archeologists, etc.) to study linked human and natural systems, i.e., socio-environmental systems.
This lesson is the third in a three-part series on networks. In this lesson, we move beyond a focus on ecological relationships alone, as in Part 1, or simply on social relationships, as in Part 2, to introduce network concepts associated with fully coupled socio-environmental networks. This lesson covers some basics on network metrics, motifs, and multiplex networks and uses a study on illegal trafficking of wildlife species to illustrate why network analysis can be useful in managing natural resources.
Assumed Prior Knowledge
Appropriate for undergraduate and graduate learners with an interest in understanding how the relational links between social actors and ecological components influence the dynamics of networks.
Learning Objectives
- Understand some of the key terms used to describe socio-environmental networks and how measures of network structure (metrics) can be useful in their analysis.
- Understand multi-layer networks and how they can be used to describe socio-environmental systems.
- Practice interpreting and applying network structure to a real-world problem.
Key Terms/Concepts
connectance; socio-ecological fit; motif; multiplex networks; ecosystem services—regulating, supporting, provisioning; socio-environmental networks; multi-level systems analysis; null models
The “Hook” (suggestions for quickly engaging students)
- Image
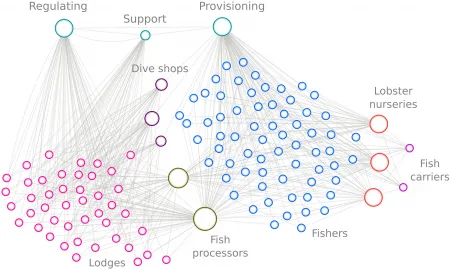
Figure 1. This is a socio-ecological network diagram representing the flow of ecosystem services (in this case, economic benefits), from coral reefs to stakeholder groups associated with fisheries and tourism. Examples of each type of service include: regulating—shoreline wave reduction by reef structure; supporting—high biodiversity; and, provisioning—fishery harvests. Colored circles for each group represent individual stakeholders, known as “actors.” From Cavada-Blanco, Croquer, Yerena, & Rodriguez (2021): doi.org/10.3389/fmars.2021.671024 In a 3-minute brainstorm, ask each learner to look at the diagram and jot down: 1) which stakeholder group they think may benefit most and why they selected it; and, 2) which group may be most at risk of collapse (e.g., financially) if some of the network ties are lost. Have learners spend 3 minutes sharing what they selected and why.
Note for instructor: Viewing only the diagram, there are no right/wrong answers. This exercise is simply to get learners focused on: the potential complexity of S-E networks; the inherent layers present (in this case, the ecological layer is represented by ecosystem services on top and the social layer is represented by actors and institutions on the bottom); the presence of subnetworks or “motifs” within a broader network (e.g., there may be tight clusters within just the lodges network); and, the varying levels of connectivity (e.g., among lodges).
-
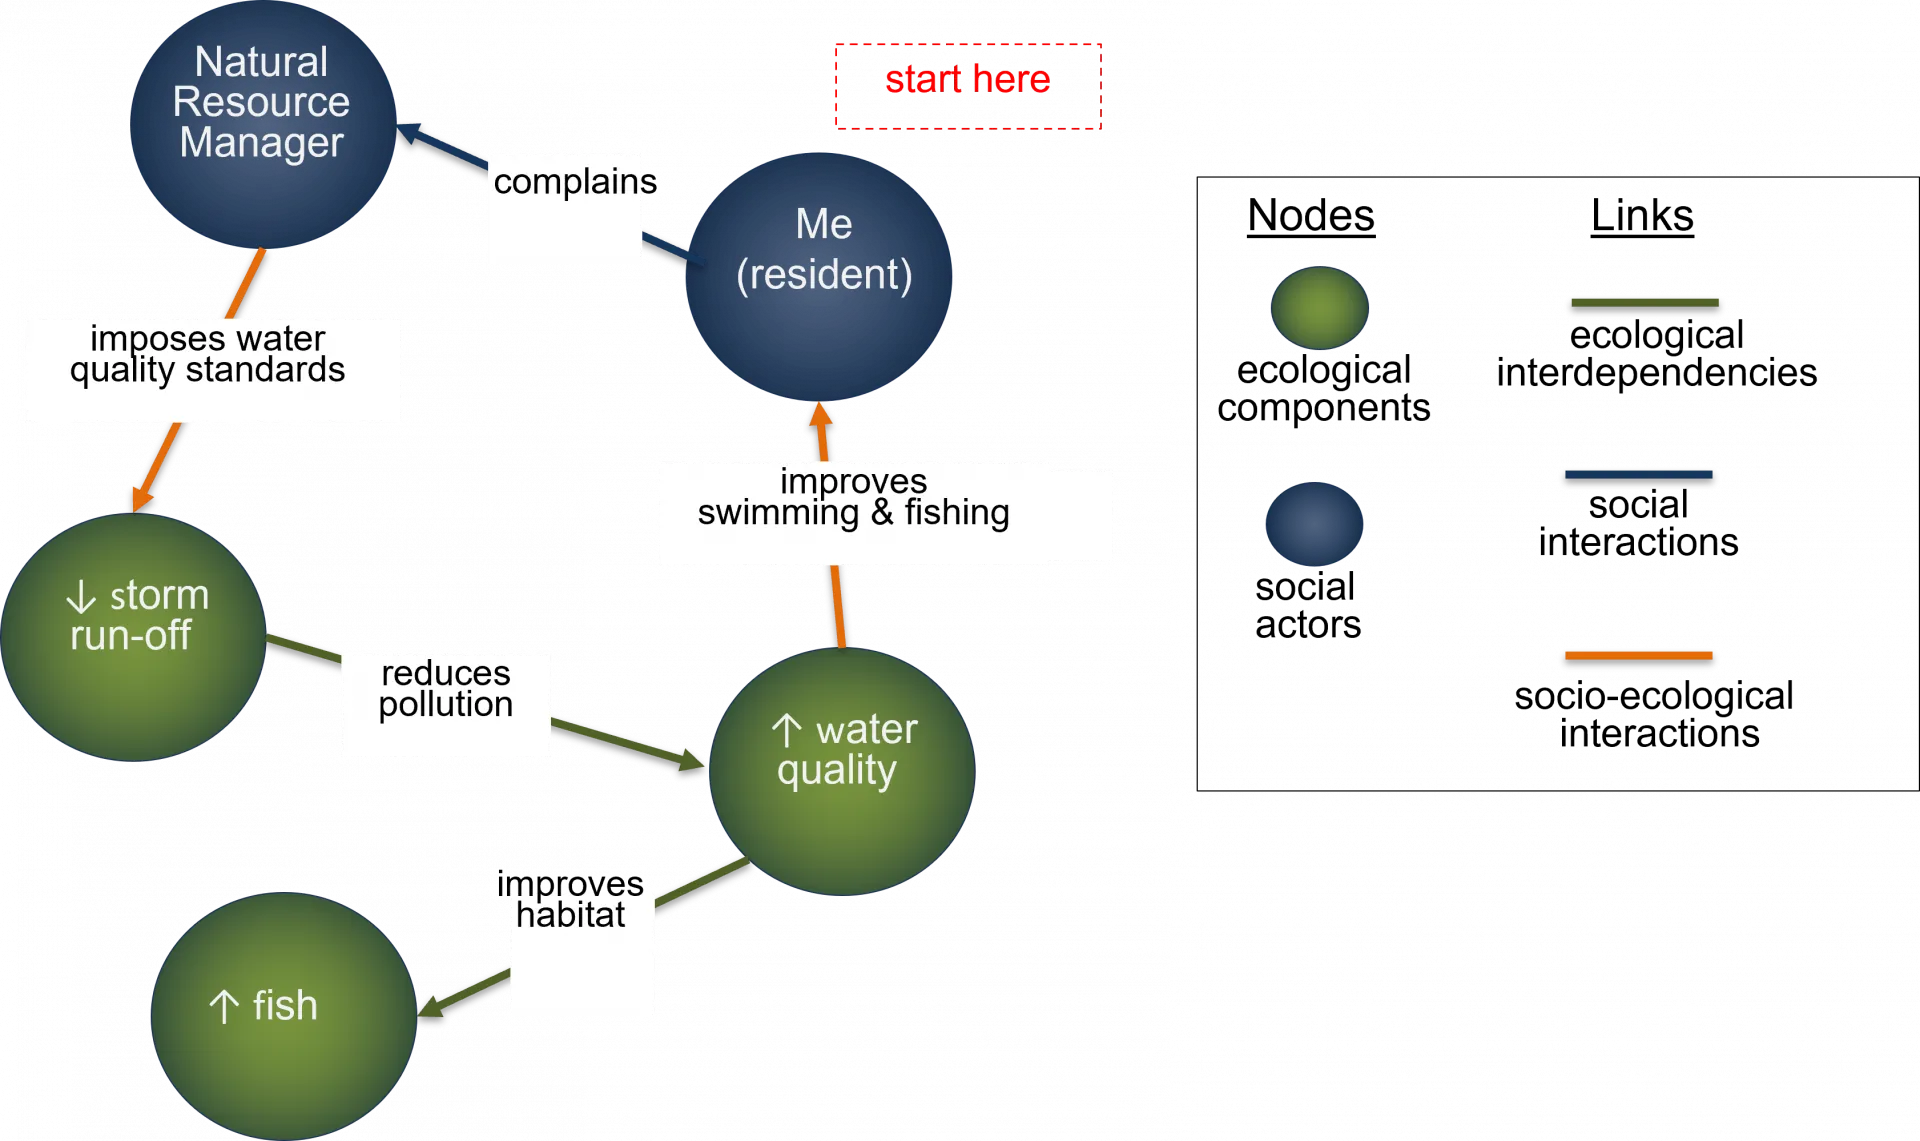
For a 3-5 min. exercise, show participants Figure 2 below and ask them to think of a different local environmental issue that affects them negatively. Examples could include: brownfields, access to a forest, air pollution from traffic, etc. Have them draw their own sketch with at least two social nodes (blue circles), one representing themselves (resident) and one representing a management entity associated with the issue. Be sure they understand that social entities (often called “actors”) can include individuals, institutions, informal groups, etc. Below their social nodes, they should create nodes for various environmental (ecological) elements linked to their issue. Have them create social, environmental, and socio-environmental links indicating interactions, jotting down a potential mechanism by which each node influences its recipient node.
Image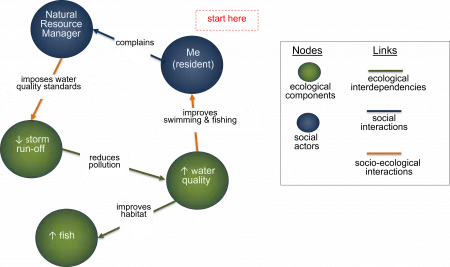
Figure 2. This socio-environmental network illustrates a social network (blue) that only includes two actors. The environmental network includes three of its components as nodes—water running off the land, water chemistry (quality), and fish abundance. The arrows indicate the direction of influence (e.g., the water chemistry influences the fish, but not vice versa) and the text on the links indicates the interaction mechanisms.
Teaching Assignments
If the participants have not completed Lesson 1 (Ecological) or Lesson 2 (Social) of the 3-part lesson on network analysis, the instructor should consider first going over the SESYNC Learning Materials PowerPoint “Network Properties: Short Introductory Slides,” being sure to prompt the participants to make guesses in response to the questions.
- Prior to class, ask the participants to: view and take notes on Dr. Lorien Jasny’s SESYNC video, “Introduction to Social-Ecological Networks,” for Part 1 of the lesson and, for Part 2 of the lesson, read and take notes on the highlighted parts of the article by Arroyave et al. (2020), “Multiplex networks reveal geographic constraints on illicit wildlife trafficking” (link below). The “Background Notes” (link below) will help the participants understand the article and they may want to read it before and after reading the highlights.
DocumentArroyave et al. 2020 HIGHLIGHTED.pdf (1.28 MB)
Document
Background on Arroyave study.docx.pdf
(150.93 KB)
- The following additional PowerPoint is useful for the instructor to use while progressing through the two parts of this lesson below.
Document
-
Network Analysis of Socio-Environmental Systems
Ask the participants to pull out the notes they took on the video by Lorien Jasny and then discuss the following questions:- Discussion Question #1:
What did Eleanor Ostrom mean by the phrase“socio-ecological fit” and how does it relate to the network concept? Think of at least one contemporary example in which the socio-ecological fit in the state or country where you live is poor.
Answer: Ostrom showed with her work that for governance to be sustainable, the institutions and linkages among them in the social world should match the scale and focus of the configurations found in the ecological world. A contemporary example of poor fit would be river management authorities that are not aligned with watershed boundaries or multiple organizations that focus on conservation of a specific natural resource but do not collaborate.
- Discussion Question #2:
Jasny discussed the concept of network “motifs”span> as small recurring subnetworks (patterns) in a network. In network analysis, motifs are more strictly defined as subnetworks that appear more often than expected when compared to a “null model.” A null model represents a baseline for a particular system, where the same number of nodes and linkages are randomly organized. Motifs can be thought of as the building blocks of networks. Searching for and studying motifs in all kinds of networks is now a common practice. Why might this be the case? What might the presence of different types of motifs mean?
Answer: Motifs have special meanings that are context-dependent. They may be subnetworks that are more influential than others or are particularly important because they are so unlikely. They are believed to reflect important mechanisms or to perform important functions within complex systems, e.g., they may represent vulnerable connections that influence network robustness. The distribution of motifs, e.g., in a three-species or three-person interaction, varies with the type of system, e.g., ecological, social, neuronal, or electrical.
Continuing with the concept of motifs, use the Network Methods, Part 3 PowerPoint presentation and have the participants respond to the following prompts:
- Discussion Question #3:
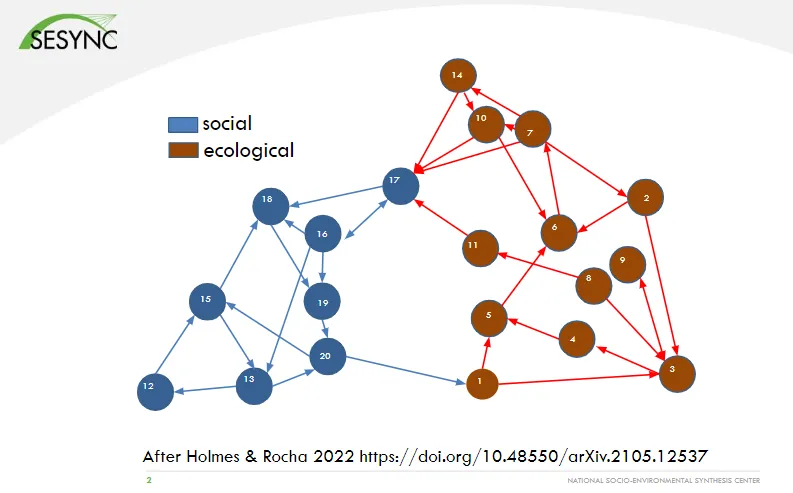
Focusing on the diagram below (slide 2), identify some of the 3- and 4-node motifs that might be least likely to occur in a null model.
Image
Answer: (Show slide 3.) Two mutually dependent nodes that influence a third node are the least likely to occur randomly. In this model, 16 and 17 influence each other and both point at 18, and therefore, represent a 3-node motif. Note: Participants may select the most obvious or common subnetworks (as in 12, 13, and 15), but they need to focus on which motifs are least likely compared to random connections.
- Discussion Question #4:
Now, identify some “anti-motifs”—subnetworks under-represented relative to null models.
Answer: (Slide 4) Triangles like the one pointing from 3 to 4, with 4 pointing to 5, are common in null models of such networks. So when they are underrepresented in networks, they are considered anti-motifs. Their absence tends to slow down the spread of opinions or disease among species, etc.
- Discussion Question #5:
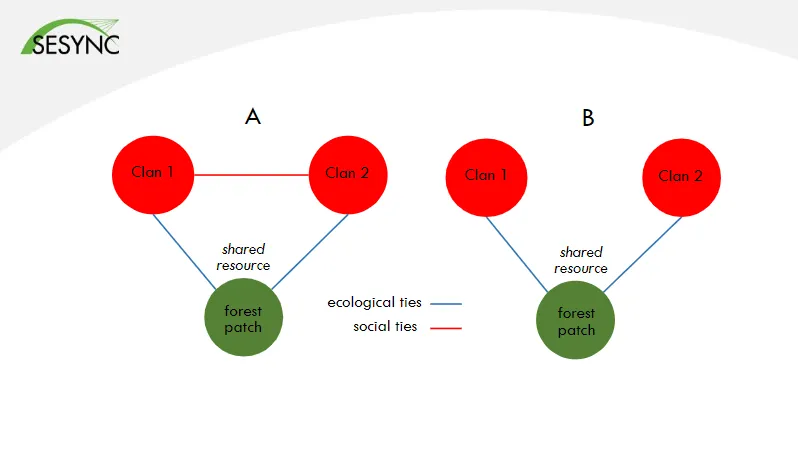
Jasny discussed work in Madagascar, where Bodin and Tengo completed a network analysis of social ties among clans and ecological resources (forest patches). Below are two patterns that could be common (slide 5). Which network is more likely to sustain the shared natural resource?Image
Answer: Closed triangles like A are statistically more likely to preserve a shared resource according to Bodin and Tengo. The inference is that this is due to collaboration and cooperation among actors, empirical evidence of which is newly developing and ongoing from other researchers.
- Discussion Question #1:
-
A Network Analysis Case Study
To start, use Slides 6-7 in the Part 3 PowerPoint to be sure participants understand what multiplex networks are and how the nodes and layers are conceptualized in the Arroyave research. Also, go over the background notes, considering the use of: spatial proxies (state level data) to represent actor (traffickers = nodes) behavior; and, a multi-plex network approach with 10 plexes (network layers), each representing a different wildlife taxon, and the links representing the source-destination for shipments.
Divide the participants into three groups and have them spend time discussing the following bulleted items and preparing comments to share with the rest of the participants. Assign each group a network metric to consider for the third bulleted assignment. Group 1 will consider the network metrics “density” and “clustering coefficient”; Group 2, the network metrics “degree centrality,” “betweenness,” and “network diameter”; and, Group 3, the network metrics “link overlap” and “reciprocity.” The definitions of each are found in supplementary information of the article.
Discussion Question #1:
What do the three motifs represent in terms of trafficker actions? (see Figure 1 in the article).
Answer: These show how traffickers could move between places as they trade multiple species. Example 1 illustrates exchanging species; Example 2 illustrates trading multiple species simultaneously; and, Example 3 illustrates trading multiple species, but not at the same time (they return later by the same path).Discussion Question #2:
The authors calculated a number of metrics for their empirical multiplex network and then compared these to metrics from three different null model networks. What did each of the null models allow them to do—i.e., why three null models?
Answer: Null model 1 allowed them to determine if a network actually had structure (i.e. patterns) or was just related to degree density in the network; Null model 2 allowed them to ask if the structure was due to degree distribution; and, Null model 3 allowed them to determine if the network structure reflected travel limitation (i.e., traffickers generally trade with those closest).Discussion Question #3:
In comparing their empirical network to the null model networks, the authors’ findings are illustrated in Figure 3, where red points are their empirical data and gray symbols are predictions of the null models (Model 1 = diamonds; Model 2 = triangles; Model 3 = boxes). If there is overlap between the red data points and the null model points, that indicates the network structure can be explained by that model. For your group’s assigned metrics, how do you think their findings could be used to reduce wildlife trafficking? For example, consider decisions such as where to concentrate police resources.
Answer: The paper’s discussion describes some of the best metrics for identifying places to police, e.g., degree centrality could help in identifying nodes that have many connections. Link overlap and reciprocity could help in identifying common routes (and ones to avoid!). The increase in network diameter as more network levels (taxa) are aggregated suggests sequential trading (Example 1 of the motif types in Figure 1).
Background Information for the Instructor
-
The Routledge Handbook of Research Methods for Socio-Ecological Systems, Chapter 23: Network Analysis
This open-access book chapter provides a good overview of network methods, as well as very good descriptions of the types of socio-ecological questions that are well-addressed by using network analysis.
Biggs, R., de Vos, A., Preiser, R., Clements, H., Maciejewski, K., & Schlüter, M. (Eds.). (2021). The Routledge Handbook of Research Methods for Social-Ecological Systems (pp. 321-331). Routledge. https://doi.org/10.4324/9781003021339
-
Reconciling conflict and cooperation in environmental governance: A social network perspective
This conceptual paper summarizes the use of Social Network Analysis (SNA) to understand the roles of cooperation and conflict in environmental management. They navigate socio-ecological networks to assess the challenges of integrating network models that represent cooperation and conflict.
Bodin, Ö., García, M.M., & Robins, G. (2020). Reconciling Conflict and Cooperation in Environmental Governance: A Social Network Perspective. Annual Review of Environment and Resources, 45, 471-495. https://doi.org/10.1146/annurev-environ-011020-064352
-
Designing an Urban Green Infrastructure Network: Balancing Biodiversity and Stakeholder Needs
This SESYNC-designed case study is an additional lesson that could be used to complement the activities above. As with all SESYNC case studies, this includes a full guide for teaching the lesson.
Stander, E., & Aronson, M. (2015, January 7). Designing an Urban Green Infrastructure Network: Balancing Biodiversity and Stakeholder Needs. SESYNC. https://www.sesync.org/resources/designing-urban-green-infrastructure-network-balancing-biodiversity-and-stakeholder-needs
-
Networking the environment: Social network analysis in environmental management and local ecological knowledge studies
Part of a special feature encompassing nine papers, this guest editorial summarizes the promises and challenges of taking a relational perspective in analyzing socio-environmental systems. The authors discuss natural resource governance as it relates to the circulation of plant species and local knowledge.
Salpeteur, M., Calvet-Mir, L., Diaz-Reviriego, I., & Reyes-García, V. (2017). Networking the environment: social network analysis in environmental management and local ecological knowledge studies. Ecology and Society, 22(1), 41. https://doi.org/10.5751/ES-08790-220141
Share