Date
Overview
Image
A downloadable version of this lesson is available here:
Document
Lesson – Ecosystem Services Part 2.pdf
(534.25 KB)
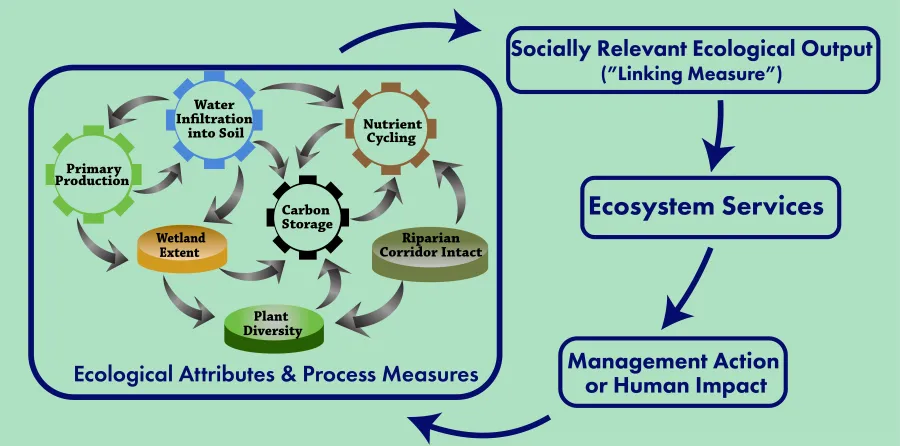
Ecologists have a long history of mapping and measuring attributes of nature (e.g., food webs, soil nutrients, genetic diversity), as well as a host of ecological processes (e.g., photosynthesis and plant growth, herbivory, hydrologic exchanges, as shown on the left side of the above figure); however, many of these qualities are not what people value from nature. For example, ecologists know that bacterial removal of excess nitrogen from water, called denitrification, is critical for the health of many coastal waters. People value productive fisheries and a chance to swim in clean water, but they may not value denitrification in the same way. The same gap between process and value is true for other scientific measurements including those associated with food web complexity, photosynthesis, genetic diversity, or a fully intact riparian corridor. These gaps make it hard to enact policies or to pay for management and restoration actions that ensure these processes and attributes of nature are healthy. However, people do value fisheries and clean water—both examples of ecosystem services—that depend on nutrient cycling, complex food webs, and photosynthesis.
Policy makers and managers need scientific measures because they provide insights into the types of management actions required. For example, knowing that the high carbon and low oxygen levels that characterize many wetlands make them ideal habitats for nitrogen-removing microbes, managers often restore wetlands along streams flowing to the coast. But to garner support for those restoration actions, there is a need for a “linking measure” between what scientists study and the ecosystem services that people care about. Such linking measures go by a variety of names: scientific or ecological outcome measures, socially relevant ecological output, benefit relevant indicators, or intermediate services. Nitrogen (N) concentration is one such indicator that is far more understandable to the public and to policy makers than denitrification. Additionally, N concentration can be used both in scientific predictions of denitrification rates and in fisheries predictions (i.e., the measurement of the amount of N in water can be linked to the underlying process we need to restore and what service we hope to gain—in this case, more fish). Thus, this measurement is useful both to scientists and for ecosystem service valuation.
As introduced very briefly in the first lesson on valuation of ecosystem services, framing environmental problems in ecosystem service terms can be very helpful when trying to justify policy-related decisions and actions. And we learned in that lesson, ecosystem services can be valued both using market and non-market methods. In this second lesson, we focus on designing actionable science by exploring how to link ecological outputs from Lesson 1 to valued and socially relevant measures, which lead to policy actions. This process involves understanding linking measures and using causal analysis to help inform management and the public. In the third lesson, we focus on intrinsic and relational values of nature, which are much more difficult to link to policy actions except conservation.
Assumed Prior Knowledge
Appropriate for undergraduate, graduate, and higher-level learners.
Learning Objectives
- Gain an understanding of the conceptual flow between certain attributes of nature and specific ecological processes that together are needed to enhance or provide ecosystem services.
- Reflect on the significance of the fact that many of the factors that scientists measure are not what the public values, and consider how to translate these attributes into actionable policy.
- Practice developing causal diagrams to reveal the relationships between what scientists measure, linking measures, ecosystem services, and human actions.
Key Terms/Concepts
linking measures; ecological attributes and processes; biophysical measure; boundary object; actionable science; causal diagram; linking measures
The “Hook” (suggestions for quickly engaging students)
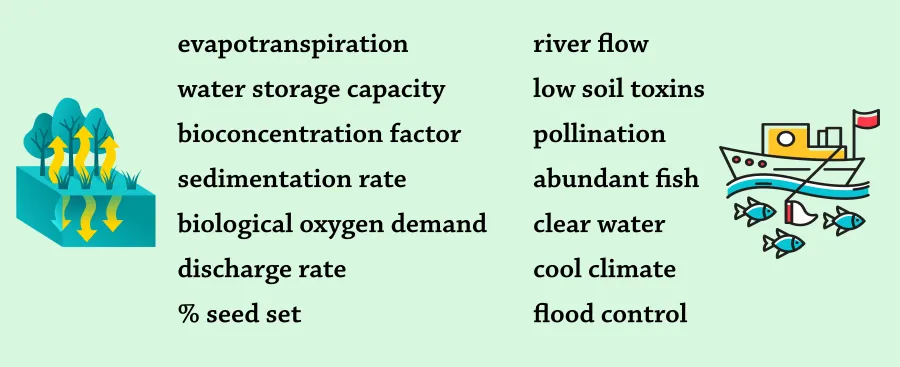
Scientists use specific terminology when they conduct research. Many of the terms are not understood by the public and when they are, people rarely link them to something in nature that they value. Try matching the term on the left (something scientists measure) with the most causally closely related ecosystem service on the right.
Image
Teaching Assignments
-
As preparation for class, have learners complete the following on their own:
- Complete the activity in the Hook
- Read and take notes on the explainer “Linking Measures: the Handshake Between Natural and Social Science Analysis” and the guide “A Causal Approach to Actionable Research Design,” both by Jim Boyd.
- Review the below PowerPoint.
Document -
(10 min.) Review the major concepts of actionable science and causal diagrams using the PowerPoint.
-
(10 min.) Divide the class into small working groups of three to five learners. Depending on the size of the class, there may be multiple groups working on the same topic, but they can target different case studies.
Assign groups to one of the following actionable science topics as a case study of improving or recovering an ecosystem service: an iconic wildlife species at risk or extirpated; an aquatic system suffering from degradation, pollution, or loss of a native species; or a degraded or mismanaged terrestrial ecosystem. Each group should specify their general area to a specific case study in a real ecosystem and conduct online searches to complete the next exercise. They are free to choose their specific case study, but what follows are some suggestions.
Wildlife groups might focus their work on wolves, bald eagles, or sea lions and focus on the following cases: gray wolves in Yellowstone Park; bald eagles in the Channel Islands; or sea otters along the coast of Alaska, Washington state, or British Columbia.
Aquatic groups might focus on efforts to recover humpback chub in the Colorado River below Lees Ferry (1, 2), recover native trout in Brooktrout Lake in the Adirondacks, or restore Poplar Island in the Chesapeake Bay.
Terrestrial ecosystem groups could focus on the Camas Prairie restoration in Oregon, restoration of the Brazilian Atlantic Forest, or dryland restoration in the Ongwam II Forest Reserve of Ghana.
-
(20 min.) Once each group has a topic and has identified a particular case study, have them:
Begin a causal diagram by identifying the desired ecosystem service(s) and putting them in a dark blue box. Try to link these services to specific species of interest or some social value—i.e., a linking measure. Put those in light blue boxes.
Add to the diagram in green circles key ecological attributes or processes that influence the status of the ecosystem or species that supports the service. In what way were/are these attributes or processes degraded? What is the stressor?
Add to the diagram several policies/actions in brown boxes that could influence these key ecological factors then add one or more linking measures to the ecosystem service. Who might implement the actions?
Identify a group of people who would be affected by these policies or actions. Type these under each brown box. Are there vulnerable groups whose needs have not previously been integrated into the calculation of benefits? Do some groups stand to gain, and some to lose, from this policy?
-
(10 min.) With the remaining class time, have each group share their draft diagram in a lightning session of 2-min. per group. To wrap up this session, ask the entire gathering: How does social value and causal diagramming provide different insights than classic ES defined by economic exchange value? How might policy makers change their designs when social value and linking measures are set as measures of success that include more-than-economic benefits to society?
-
As an optional extension, dedicate a second class session to this topic. Groups would be able to receive feedback on their draft diagrams and revise them to include more nodes and layers of socio-environmental impact flow (~20 min). Then, ask groups to draft a public relations campaign based on their social benefit and linking measure priorities. How would they “sell” the general public on a specific environmental management policy, based on the argument that it has real, tangible benefits to the population (~30 min)? Have each group then present their policy pitch in a mock town hall session, with 5-min. presentations and “community” feedback from peers. This exercise may result in an amplification not only of social benefits, but also the illustration of tradeoffs and unanticipated consequences from policy choices.
Background Information for the Instructor
-
Final Ecosystems Goods and Services Metrics
This U.S. Environmental Protection Agency website contains a great deal of information (and extensive links for more) on what author Paul Ringgold calls “Final Ecosystem Goods and Services.” This phrase simply refers to what people value, but he labeled it “Final” to reflect the fact that intermediate or linking measures are needed to relate ecological attributes and processes to ecosystem services. He and others have developed a step-by-step process for analyzing how changes to ecosystems impact human welfare.
Ringold, P., Phifer, C., & Andrews, F. (Eds.) (2020). Metrics for National and Regional Assessment of Aquatic, Marine, and Terrestrial Final Ecosystem Goods and Services. U.S. Environmental Protection Agency, Pacific Ecological Systems Division, Center for Public Health & Environmental Assessment. https://www.epa.gov/eco-research/final-ecosystem-goods-and-services-fegs-metrics-report
-
Valuing Ecosystem Services
This chapter provides an overview of ES challenges and details recommendations based on UNESCO indicators. The authors argue that ES should have the following properties: (1) be meaningful to an external audience, (2) have an agreed-upon, scientifically sound meaning, (3) be representative of an environmental aspect of importance to society, and (4) assist decision making by being efficient and cost-effective to use.
Wainger, L.A., & Boyd, J.W. (2010). Valuing Ecosystem Services. In K. McLeod & H. Leslie. (Eds.) Ecosystem-Based Management for the Oceans. Island Press.
-
BRIs: What Are Benefit Relevant Indicators?
This website from the Assessment Framework of the National Ecosystem Services Partnership provides more detail on linking measures (here they are called Benefit Relevant Indicators), including considerations of ES demand, use value, nonuse value, and other social benefits. The authors provide questions to assess whether a benefit is socially relevant and best practices for articulating BRIs.
Olander, L., Johnston, R.J., Tallis, H. et al. (2016). Federal Resource Management and Ecosystem Services Guidebook (2nd ed.) National Ecosystem Services Partnership, Duke University. https://nespguidebook.com/assessment-framework/what-are-benefit-relevant-indicators
Share